
Use Query Monitor first for a slow WordPress backend. Then use New Relic when the problem is bigger, sneakier, or only happens on the live site at random times. Query Monitor is your flashlight. New Relic is the security camera footage.
TLDR: Query Monitor is best for checking one slow WordPress admin page right now. New Relic is better for spotting patterns across many visits, users, plugins, database calls, and server events. For example, a WooCommerce store saw its product edit screen jump from 2.4 seconds to 9.8 seconds; Query Monitor found one plugin query taking 6.1 seconds, while New Relic showed checkout slowdowns spiking by 38% during sale traffic. Use both if the backend keeps acting like it is stuck in wet cement.
Why the WordPress backend gets slow
The WordPress admin area can slow down for many boring reasons. Sadly, boring does not mean harmless.
Common suspects include:
- Heavy plugins loading too much stuff on every admin page.
- Slow database queries from orders, posts, users, or meta tables.
- External API calls to payment, shipping, license, or analytics services.
- Bloated options in the wp_options table.
- Low PHP memory or a tired server.
- Admin AJAX requests firing again and again like tiny gremlins.
- Object cache issues that make the site rework the same task.
It drives me crazy that one bad plugin screen can make the whole admin feel broken. You click “Update.” Then you wait. Then you wonder if your laptop died. It did not. WordPress is just chewing on something nasty.

Query Monitor: the quick detective
Query Monitor is a free WordPress plugin. You install it. You open a slow admin page. It shows what happened during that request.
That makes it great for right now problems.
It shows:
- Page generation time.
- Memory usage.
- Database query count.
- Slow database queries.
- Which plugin or theme caused each query.
- PHP errors and warnings.
- HTTP API calls.
- Hooks and actions.
- Scripts and styles loaded on the page.
Query Monitor feels like opening the hood of a car while it is making the clunking sound. You can see the loose part. You can point at it. You can say, “Ah. That plugin is being ridiculous.”
When Query Monitor is perfect
Use Query Monitor when:
- One admin screen is slow.
- You can repeat the issue.
- You need a fast plugin check.
- You want to spot one ugly database query.
- You are working on staging or local development.
Here is a simple example. Your WordPress posts list takes 7 seconds to load. Query Monitor shows 420 database queries. One SEO plugin creates 255 of them. Now you have a suspect. No guesswork. No magic smoke.
Where Query Monitor gets annoying
Query Monitor only shows the current request. That is useful, but limited. If the admin is slow at 2 p.m. but fine at 2:10 p.m., you may miss it.
It also runs inside WordPress. So if the server is choking, PHP workers are stuck, or MySQL is under pressure, Query Monitor may not tell the full story.
Honestly, it feels like asking one waiter why the whole restaurant is slow. Helpful? Yes. Complete? Not always.
New Relic: the full performance camera
New Relic is an application performance monitoring tool. It watches your site over time. It tracks requests, database calls, PHP transactions, external services, errors, and server behavior.
It is not just for one page load. It is for the whole show.
New Relic can show:
- Slow WordPress admin transactions.
- Average response time over hours or days.
- Worst performing plugins or functions.
- Slow database queries across many requests.
- External service delays.
- Error rates.
- Server resource pressure.
- Performance changes after a plugin update.
This is where New Relic shines. It helps when the slow backend is not easy to repeat. Maybe editors complain at lunch. Maybe orders slow down during a sale. Maybe the dashboard freezes only when inventory sync runs.
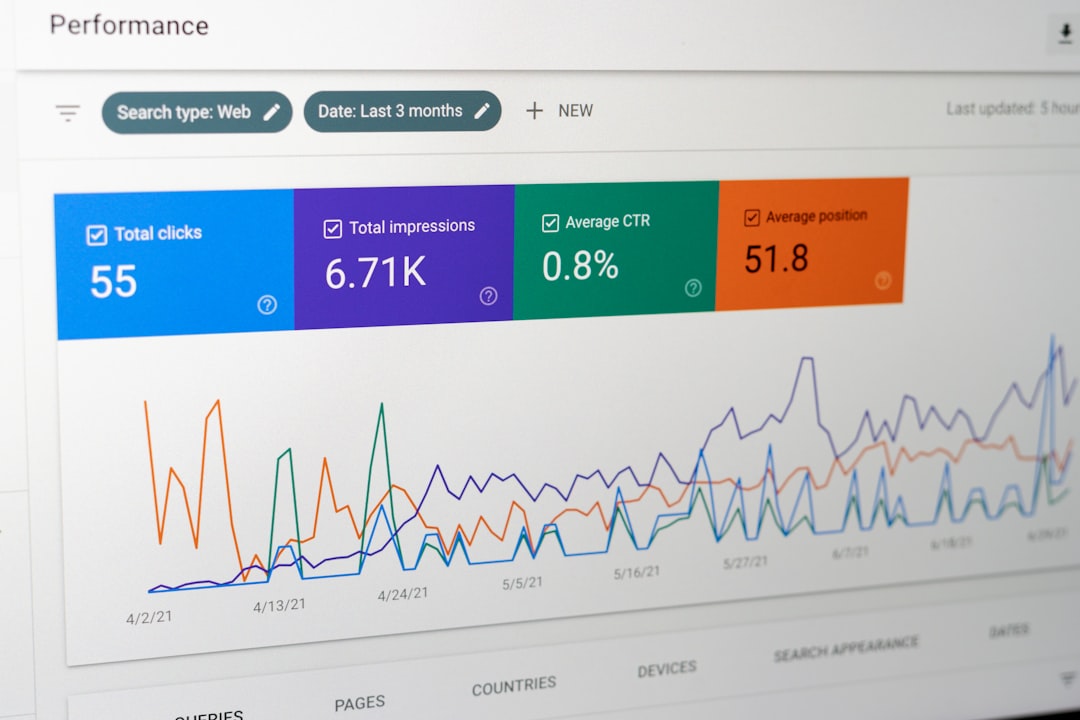
When New Relic is the better choice
Use New Relic when:
- The issue happens on production.
- The slowness comes and goes.
- You need history, not just one request.
- You manage a WooCommerce store.
- You need to track traffic spikes.
- You suspect server, database, or API trouble.
- You need proof for a host or developer.
Example time. A membership site has a slow admin dashboard every Monday morning. Query Monitor looks normal during your test. New Relic shows a background membership sync starting at 9:00 a.m.. During that window, admin response time rises from 1.9 seconds to 11.3 seconds. The culprit is not the dashboard. It is the sync job hogging resources.
Where New Relic can be a pain
New Relic needs setup. It may require server access. Some hosts offer it in the control panel. Others make you ask support. Some plans cost money.
Also, the screens can feel busy at first. There are charts, traces, transactions, spans, errors, and labels. Great when you know what you want. A bit much when all you wanted was, “Why is the admin slow?”
Query Monitor vs New Relic: simple comparison
| Feature | Query Monitor | New Relic |
|---|---|---|
| Best use | Debug one WordPress request | Track performance over time |
| Cost | Free | Often paid, or host provided |
| Setup | Install a plugin | Install agent or enable via host |
| Skill level | Beginner to intermediate | Intermediate to advanced |
| Shows history | No | Yes |
| Best for plugins | Very good | Good with traces |
| Best for server issues | Limited | Very good |
A simple workflow that works
Do not start with fancy charts if you do not need them. Start small. Then zoom out.
- Reproduce the slow page. Open the exact admin page that feels slow.
- Turn on Query Monitor. Check load time, memory, queries, and HTTP calls.
- Find the loudest item. Look for one plugin, query, or remote call taking too long.
- Disable safely on staging. Test with the suspect plugin off.
- Check New Relic if needed. Look for slow transactions and time patterns.
- Compare before and after. Numbers beat vibes.
For example, if Query Monitor says an admin page takes 8.4 seconds and one shipping plugin HTTP call takes 5.2 seconds, you have a clear lead. If New Relic also shows that same external service failing 12% of the time, your case is even stronger.

Which one should you choose?
Choose Query Monitor if you are a site owner, developer, or support person trying to fix a visible admin slowdown today. It is fast. It is free. It gives clear clues.
Choose New Relic if your site earns money, has many users, runs WooCommerce, or suffers from random slowdowns. It gives history. It shows patterns. It helps catch problems while you are sleeping.
The best answer is often both. Query Monitor tells you what happened on this page. New Relic tells you how often it happens, when it happens, and how bad it gets.
Final recommendation
If your WordPress backend is slow, install Query Monitor first. Check queries, plugins, memory, and HTTP calls. You may find the problem in five minutes.
If the issue returns later, or only appears under traffic, add New Relic. It will show the bigger pattern. You will stop guessing. Your admin will stop feeling like a sleepy turtle. And yes, your “Update” button may finally stop taking a coffee break.